U.S. Basin Map – U.S. Natural Gas Pipeline Map – U.S. LNG Export Map
U.S. Basin Map – U.S. Natural Gas Pipeline Map – U.S. LNG Export Map
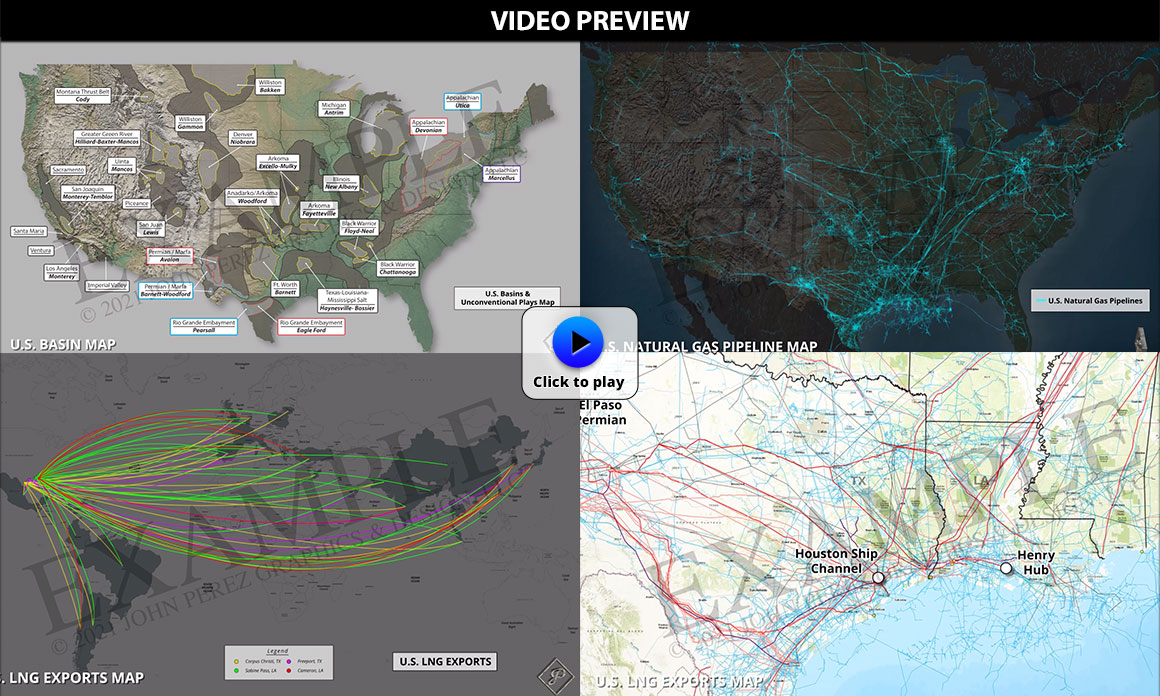
U.S. Basin Map
The map illustrates major U.S. basins and unconventional oil & gas plays. It is a one-of-a-kind, custom-built map. The dimensions are 137 inches wide x 6.5 feet tall allowing to be printed large format for wall display or can be sized as needed for websites and presentations.
U.S. Natural Gas Pipeline Map
This U.S. Natural Gas Pipeline map was custom built and is part of our STOCK library. The animated file is 1920 x 1080 pixels and can be used in presentations and on your website. The high-resolution print file is 12”h x 22”w @ 300 dpi resolution which can be printed as large as 48” x 88” and still hold its original quality.
The map shows pipeline routes across the United States that were constructed over decades. This critical infrastructure carries the valuable natural gas resource from producing basins to cities across America suppling our country with essential energy, and an important feed stock in making products we use every day.
LNG – Liquefied Natural Gas Map
This a one-of-a-kind, custom-built STOCK map illustrates where four of the world’s largest petrochemical complexes and LNG export facilities are in Texas and the Louisiana gulf coast area. The graphic also shows the many countries worldwide that receive LNG exports from the U.S.
U.S. Oil & Natural Gas Consumption Meter
Petroleum is the largest U.S. energy source, and along with natural gas and coal, these natural resources provide over 80% of our country’s energy consumption. Data Source: U.S. Energy Information Administration.
Oil & Gas consumption meter features:
- Year-to-date consumption
- Today’s consumption
- Consumption since you arrived
- Website ready with easy-to-install files.
Crude Oil (Barrels)
YTD Consumption
2273559699
Today's Consumption
18658630
Consumption Since You Arrived
0
Natural Gas (Cubic Feet)
YTD Consumption
10055473933430
Today's Consumption
82523177083
Consumption Since You Arrived
0
Watch our 3D Oil and Gas Animation Demo Reel
Please take a look at our latest technical animation work! You’ll see that our creative team is continuing to push beyond their comfort zone to create that “WOW” experience for every client’s play, tool or oil and gas technology project with our animated graphics. Need to explain enhanced oil recovery, stacked pay or oil investments in unconventional oil? No problem. Our seasoned technical animator team specialize in process, mechanical and industrial animations as seen in our animation demo reel.
With new effects and cutting-edge, 3D modeling software, we can go beyond the norm and create that one of a kind technical animation, illustration, or oil and gas graphic animation you’re looking for! These 3D oil and gas graphics are from many projects we have created up to this point. Look, experience and…