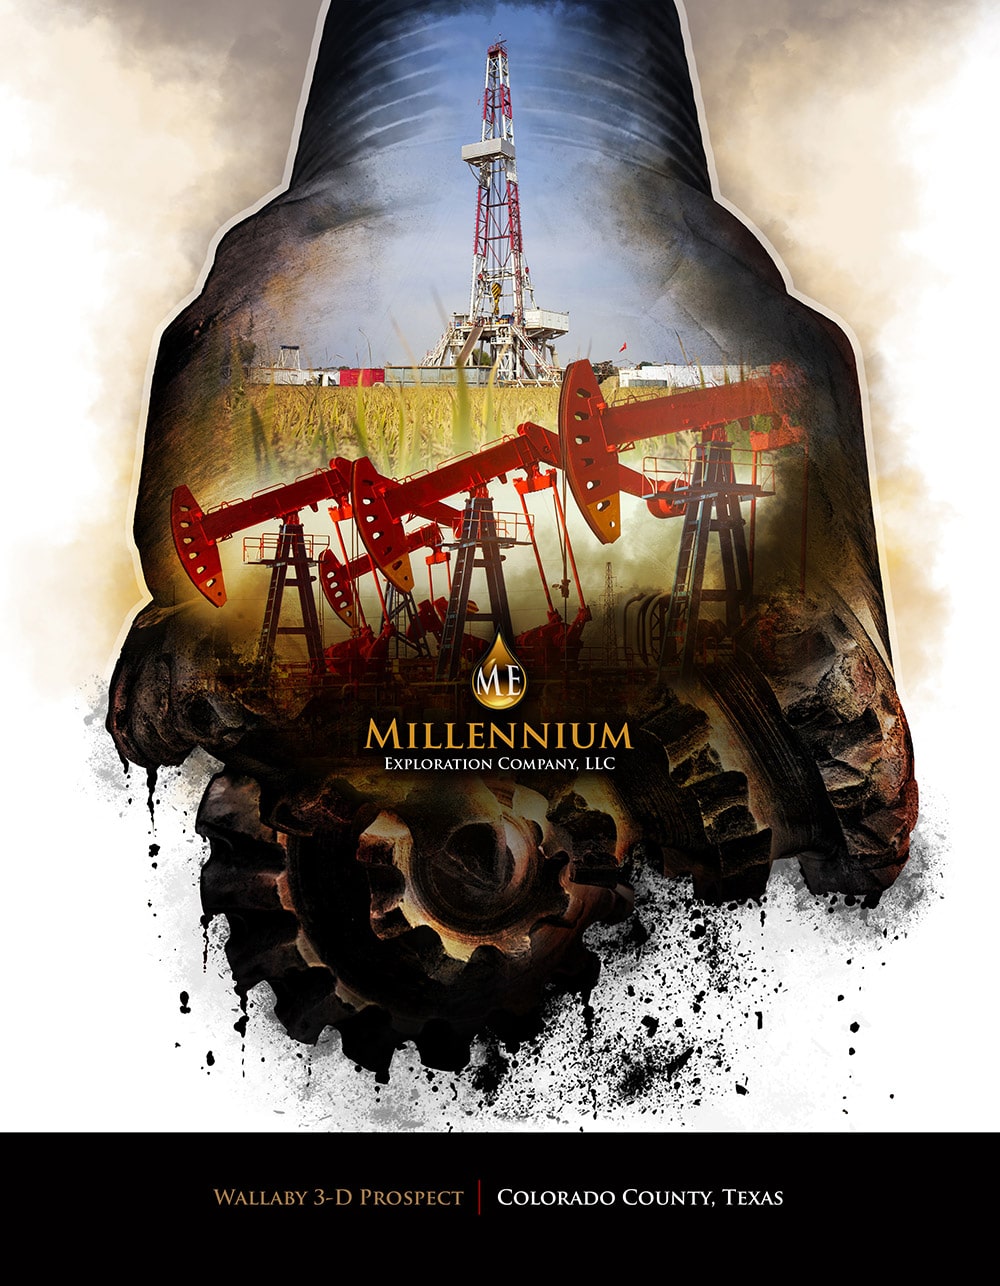
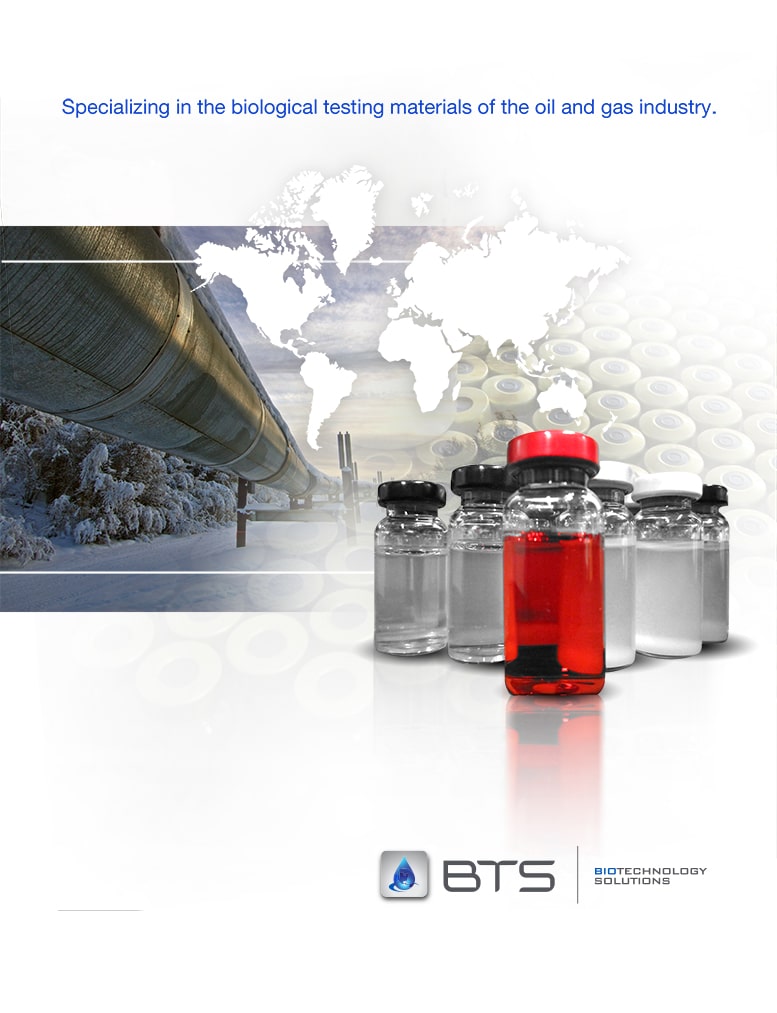
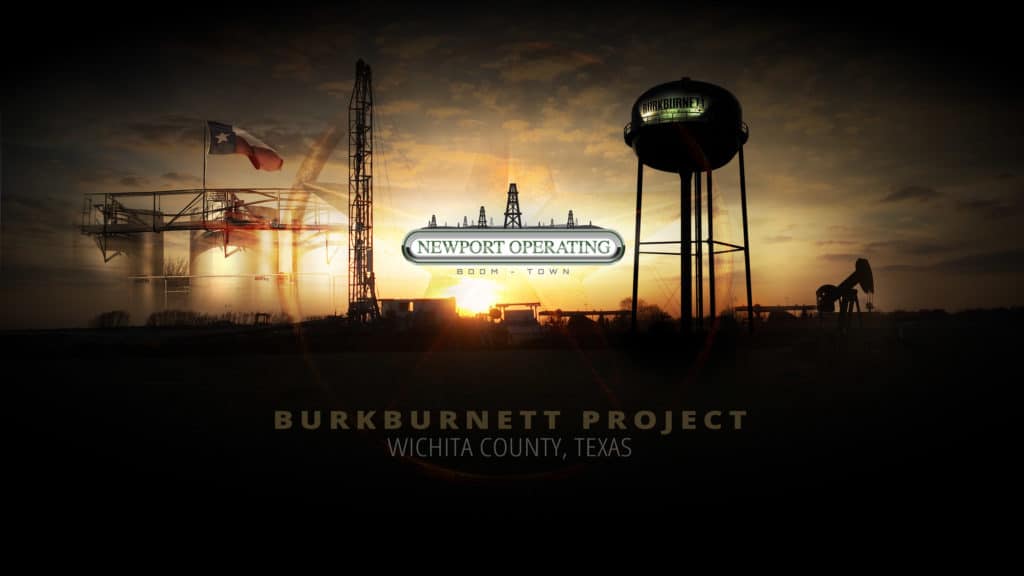
Custom Oil Gas Graphics
Custom Core Lab Illustration
Take a look at this oil gas illustration that was created as the cover wrap for Core lab’s 2017 Annual Report. Because of the size (13’x9′) and detail that went into this custom oil gas graphic it has been deemed the “Beast”.
You can view Core Lab’s latest annual report we created by clicking this button below
Click here for Core Lab’s Flip Book
You can view Core Lab’s latest annual as a PDF by clicking this button below
You can view Core Lab’s Poster
If you have questions or want our team to design your next graphic or annual report – Click Here
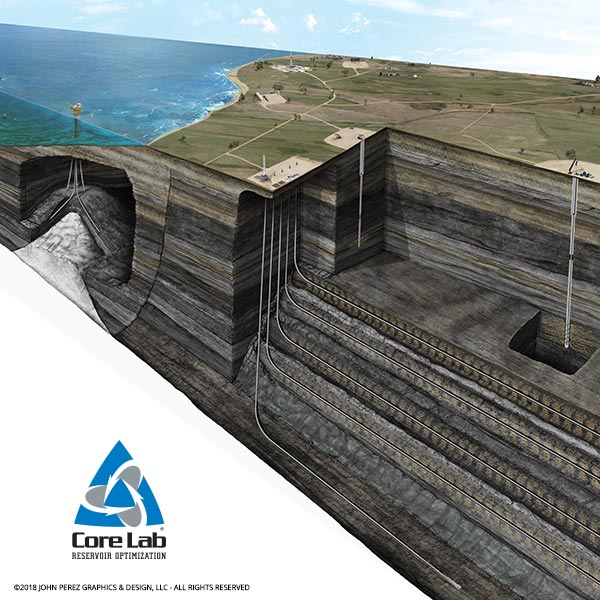
Custom Edwards Aquifer Illustration

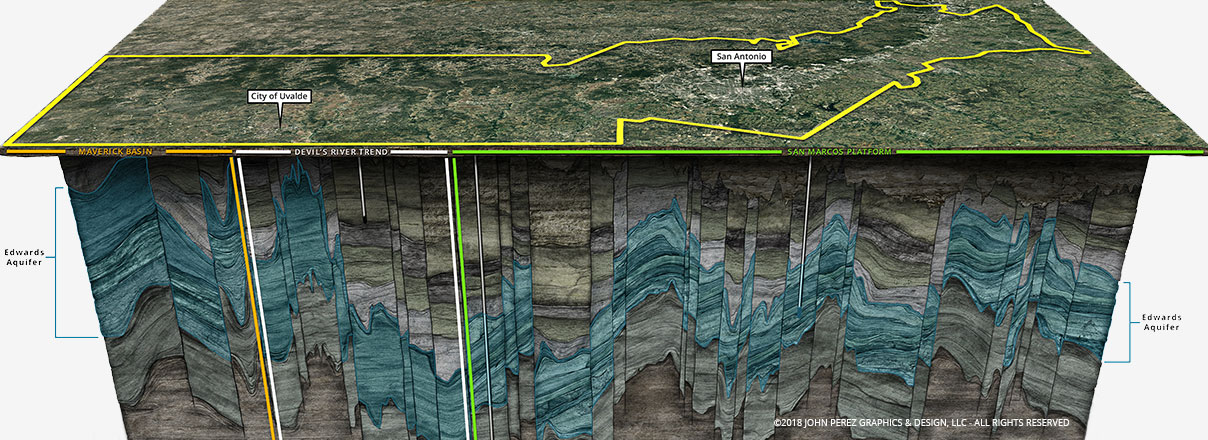
WE KNOW SCHEMATICS… WHAT DO YOU THINK?
With our experience in the oilfield, we understand your visual needs. Our background isn’t just sitting behind a computer and copying someone else’s work. We have worked at refineries, on rigs and chased seismic trucks in the middle of nowhere. Been there, done that. We are the innovators, the creators. Our work is cutting edge.
So whether it’s an idea, chicken scratch on a napkin, seismic or geologic data, we can turn any of these sources into a compelling, easy to understand illustration.
That’s what we do.
View the Edwards Aquifer Illustration

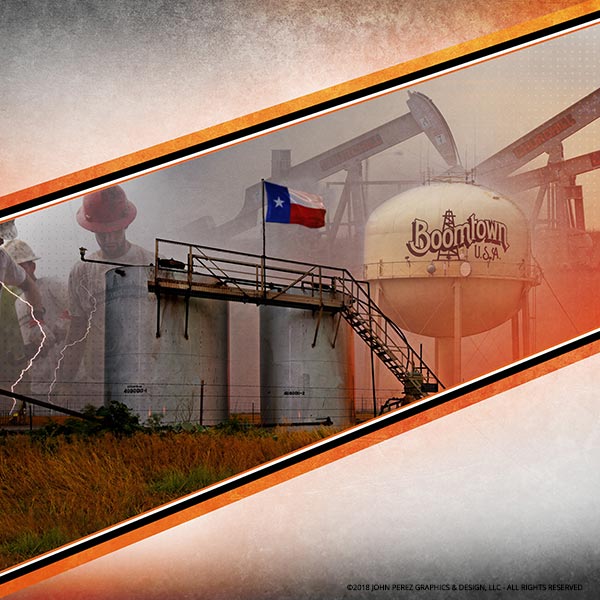
Custom Tradeshow Graphics
With our experience in the oilfield, we understand your visual needs. Our background isn’t just sitting behind a computer and copying someone else’s work. We have worked at refineries, on rigs and chased seismic trucks in the middle of nowhere. Been there, done that. We are the innovators, the creators. Our work is cutting edge.
So whether it’s an idea, chicken scratch on a napkin, seismic or geologic data, we can turn any of these sources into a compelling, easy to understand illustration.
You can view Core Lab’s Poster
If you hav any further questions click the button below

This is an example of the experience and detail that goes into a John Perez Graphics Custom Schematic Illustration
WE KNOW SCHEMATICS… WHAT DO YOU THINK?
With our experience in the oilfield, we understand your visual needs. Our background isn’t just sitting behind a computer and copying someone else’s work. We have worked at refineries, on rigs and chased seismic trucks in the middle of nowhere. Been there, done that. We are the innovators, the creators. Our work is cutting edge.
So whether it’s an idea, chicken scratch on a napkin, seismic or geologic data, we can turn any of these sources into a compelling, easy to understand illustration.
That’s what we do.
Other Custom Graphics
With our experience in the oilfield, we understand your visual needs. Our background isn’t just sitting behind a computer and copying someone else’s work. We have worked at refineries, on rigs and chased seismic trucks in the middle of nowhere. Been there, done that. We are the innovators, the creators. Our work is cutting edge.
So whether it’s an idea, chicken scratch on a napkin, seismic or geologic data, we can turn any of these sources into a compelling, easy to understand illustration.
That’s what we do.
